Message from the Secretary
Transportation is critical to Pennsylvania's economic vitality and well-being. We see that theme across history, and it holds true today in a time of transformative change. Now, enabled by technology and driven by data, the Commonwealth's transportation system can become more efficient, responsive, sustainable, resilient, and equitable than ever before
Pennsylvania's 2045 Long-Range Transportation Plan (LRTP) outlines a future transportation system that
Pennsylvanians are creating together.
Transportation agencies provide facilities and services essential to everyday life. As such, we must be
able to react effectively to abrupt changes and urgent situations, such as those thrust upon us by the
COVID-19 pandemic and the relentless impacts of climate change. The Pennsylvania Department of
Transportation (PennDOT) makes investments in roadways, bridges, public transit, and other
infrastructure that last decades, and must do so with a strategic future perspective that considers
big-picture outcomes for the Commonwealth's transportation system and its users.
The plan's goals are inspiring and were developed based on broad engagement with diverse stakeholders,
the public, and underrepresented interests, which is the cornerstone of the planning process. This
resulted in wide-ranging and valuable feedback, so much so that a major goal and objectives specific to
addressing equity are a key part of the LRTP.
Our ability to achieve these goals—even with the extensive collaboration with our partners and
stakeholders—depends upon securing adequate resources. Implementing strong investment proposals like
that put forward by the Transportation Revenue Options Commission will be essential for advancing much
of this plan.
Under any funding scenario, collaborating with other agencies, other levels of government, the private
sector, MPOs/RPOs, and the public is vital to making positive, systemwide improvements. I am pleased
with the diverse engagement that has occurred with such partners, with the aim of collaborative
implementation to accomplish common purposes.
Transportation is about fostering opportunity. We must make wise investments in our infrastructure and
services that yield great returns, opening opportunities for all Pennsylvanians. As stewards of the
statewide transportation system, that mindset is at the heart of this plan and our commitment to
implementing its strategic actions and initiatives. We are embracing new tools, skills, processes, and
perspectives to accomplish this plan.
A special thank you to the many individuals who provided input during the development of the
Commonwealth's 2045 Long Range Transportation Plan. We ask that all Pennsylvanians remain involved as we
implement the plan's action strategies and initiatives that will strengthen our transportation system,
programs, and services long into the future.

Pennsylvania Department of Transportation
The Essentials
The statewide long-range transportation plan (LRTP) establishes a direction for Pennsylvania's transportation system across a 20-year planning horizon.
This 2045 PA LRTP has been developed alongside a PA Freight Movement Plan (FMP), available on PennDOT's Planning Program's Project Webpage. The two plans complement each other, establishing a comprehensive direction for enhancing the movement of people and goods within and through the state.
The statewide LRTP does not include specific projects, such as bridge replacements or major road improvements. These projects are developed regionally by the state's metropolitan and rural planning organizations (MPOs/RPOs), known as PennDOT's Planning Partners. Each MPO/RPO develops a regional LRTP in step with the statewide direction.
PennDOT produces modal and functional plans that relate to the LRTP, including:
Transportation Planning Process
Long-range planning is one of three key phases of transportation improvement. Plans guide development of
Transportation Improvement Programs (TIP) established at the regional level. The TIP projects are rolled up
into a Statewide Transportation Improvement Program (or STIP) and included in the statewide 12-Year Program
(TYP), which is updated every two years.
In the off-year, the State Transportation Commission (STC) and Transportation Advisory Committee (TAC)
compile a Transportation Performance Report (TPR), which serves as a report card on the transportation
system and helps direct future programming to achieve plan goals. It is a cornerstone of the TYP development
process.
The update of both the LRTP and 12-Year Program included extensive outreach to the public and transportation
stakeholders to ensure that public perspectives are considered as part of the process.
More information about the transportation planning process is available on Talk PA
Transportation.
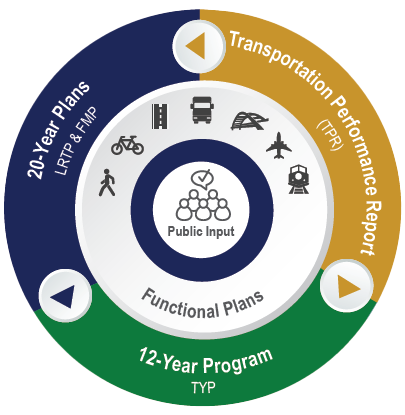
Sets Direction
- Long-Range Transportation Plan (LRTP) 20-Year Plan
(Updated every 6-10 years)- Where do we want to go?
- Goals
- Objectives
- Measures
- How are we going to get there?
- Implementation Strategies
- Policies
- Priorities
- Functional Plans
- MPO/RPO LRTPs
- Where do we want to go?
Prioritizes Projects
- 12-Year Program (TYP)
- How can we best use available funding?
- Lists funded projects for a 12-year period
- First four-year period is the Statewide Transportation Improvement Program (STIP)
- STIP complies MPO/RPO Transportation Improvement Programs (TIP)
- How can we best use available funding?
Measures Progress
- Transportation Performance Report (TPR)
(Updated in odd-numbered years)- How did we do?
- Monitor
- Report
- Evaluate
- Where do measures come from?
- State and Federal Requirements
- What do we measure?
- Safety
- Mobility
- Accountability
- Funding
- Preservation
- How did we do?


Public & Stakeholder Involvement
Many voices throughout the Commonwealth provided the foundation for effective development and successful implementation of Pennsylvania's 2045 LRTP. The scope and scale of outreach conducted for the LRTP was greater than for any previous plan. The users of the statewide transportation network provide an essential perspective in helping to shape the plan's strategic directions.
To capture transportation system needs and concerns across Pennsylvania, input was solicited in various forums and incorporated at key points during plan development. In addition to statewide public outreach and stakeholder engagement, extensive “in-reach” was a key element of the stakeholder engagement process. PennDOT units and partnering agencies and organizations were engaged to ensure that current and future initiatives would be properly reflected and supported by the LRTP's implementation plan.
The success and implementation of the LRTP strongly depends on public and stakeholder involvement and participation. Feedback was requested on the draft plans through the Public Comment Period from September 20 – October 19, 2021.
Significant effort was made to maximize public outreach during the comment period, through social media, email campaigns and targeting underserved populations such as senior citizens, people with disabilities, and marginalized communities.
This combined outreach process was used for both the 12-Year Program and the LRTP.
 Public Outreach
7,400
Public Surveys Completed
1,905
Public Forum Views
2,700
E-News Contacts
11
Social Media Posts
 Stakeholder Engagement
24
MPOs and RPOs Engaged
8
STC & TAC Presentation
5
Freight Focus Group
Meetings by Mode
225
Freight Forum Registrations
25
Equity & Diversity Workshop Attendance
9
PennDOT Planning Network e-Blasts
49
State Planning Board Attendance
 PennDOT In-reach & Interagency Collaboration
35
Executive Interviews
40
PennDOT Bureau/District Personnel Engaged
5
Partnering Agency Interviews & Presentations
 Public Comment Period Engagement
183,392
Social Media Reach
2,230
Public Website Page Views
8,083
Email Campaign Contacts
17
Federally Recognized Tribes Contacted for Feedback
618
Public Libraries with Printed Copies
*Social Media Definitions
-
1. Reach is the number of people who saw any content from the PennDOT page or about the PennDOT
page.
2. Impressions are the number of times any content from PennDOT or about PennDOT entered a person's screen.
3. Engagement is any action someone takes on PennDOT’s page or one of PennDOT’s posts.
What We Heard
Key Themes from the Public Survey
Public feedback was obtained through an online public survey and public forum hosted by PennDOT and the STC for the 2023 12-Year Program update. Extensive outreach and promotions were launched through the STC website, including email blasts to thousands of stakeholders, a targeted social media campaign offered in Spanish and Mandarin—the two most-spoken languages in Pennsylvania after English-traditional media outreach, and outreach in partnership with stakeholders.
1. Road Pavement
Repairing, restoring, reconstructing, and maintaining state and local roads

2. Bridges
Repairing, replacing, and maintaining state and local bridges

3. Traffic Flow
Using technology to improve traffic flow, add new lanes, and construct new roads

4. Interstate Highways
Specific, prioritized investments in Interstate reconstruction

5. Walking
Accessible and connected walking routes

6. Transit
Accessible and frequent public transportation options that cover an extensive area and cross regions
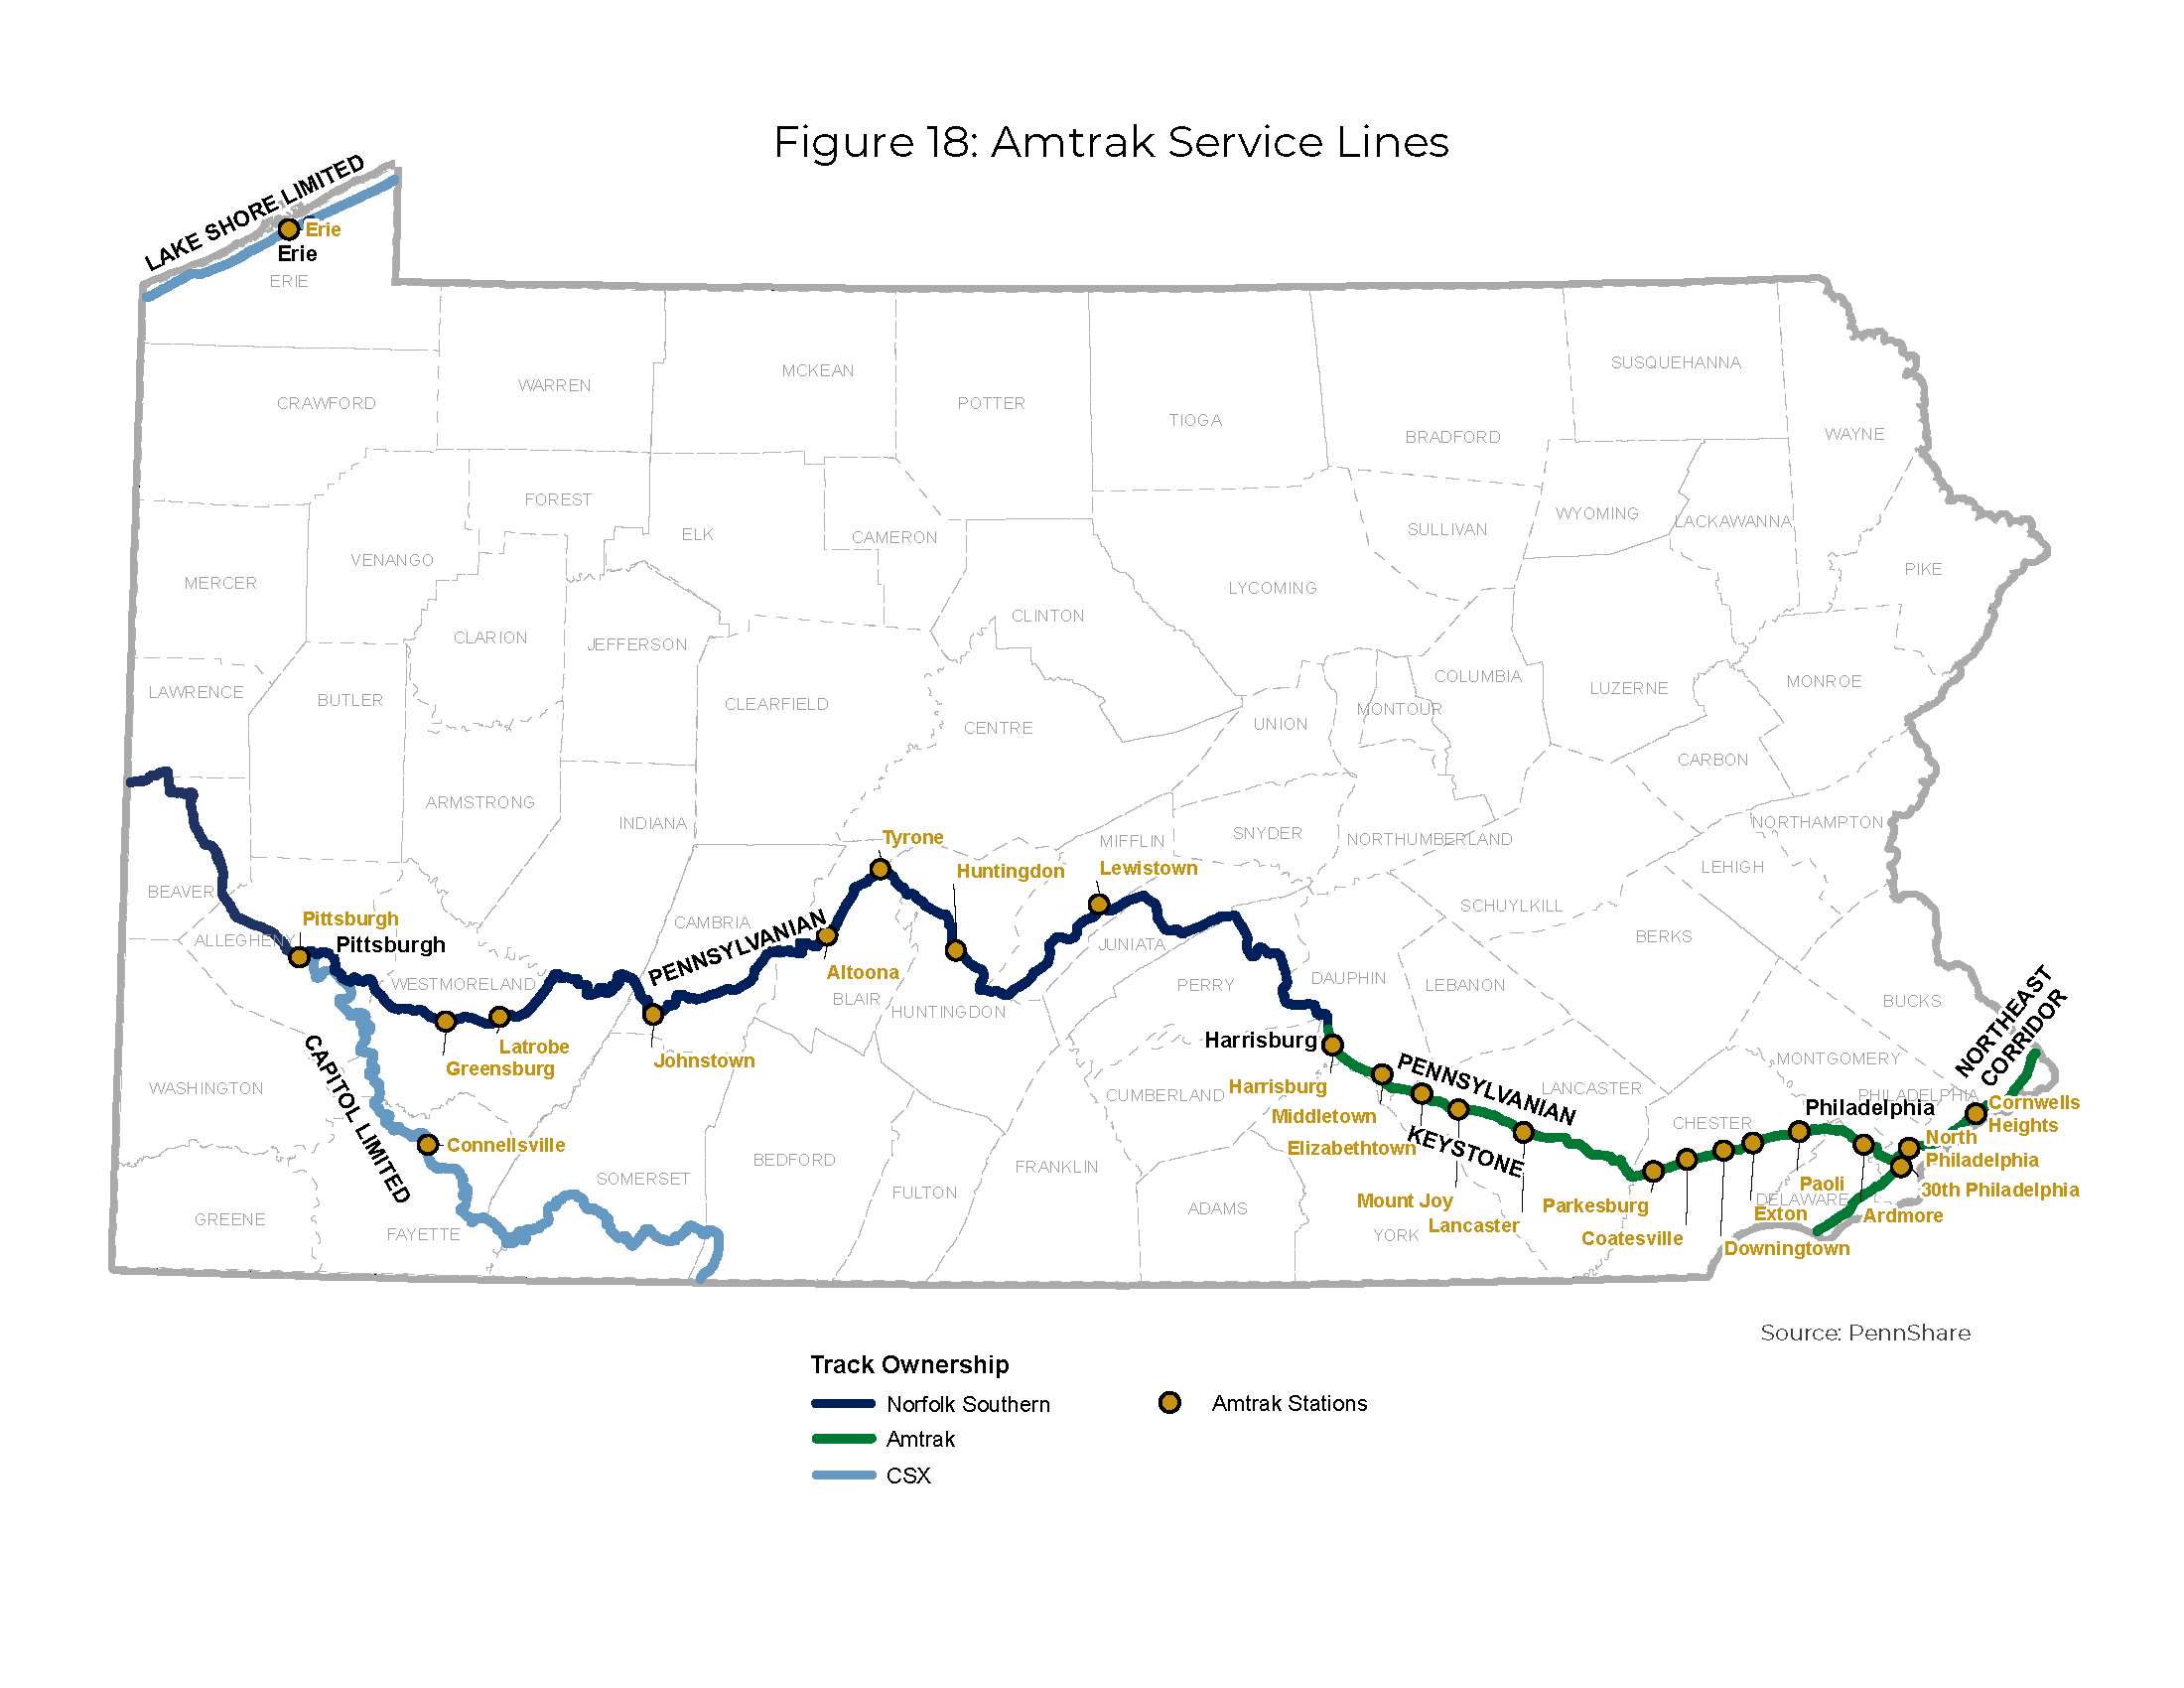
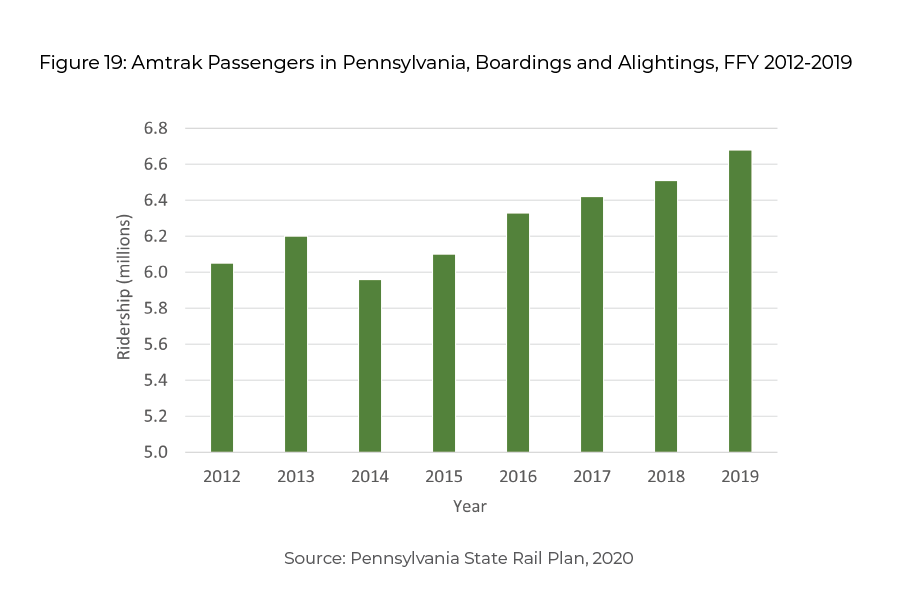
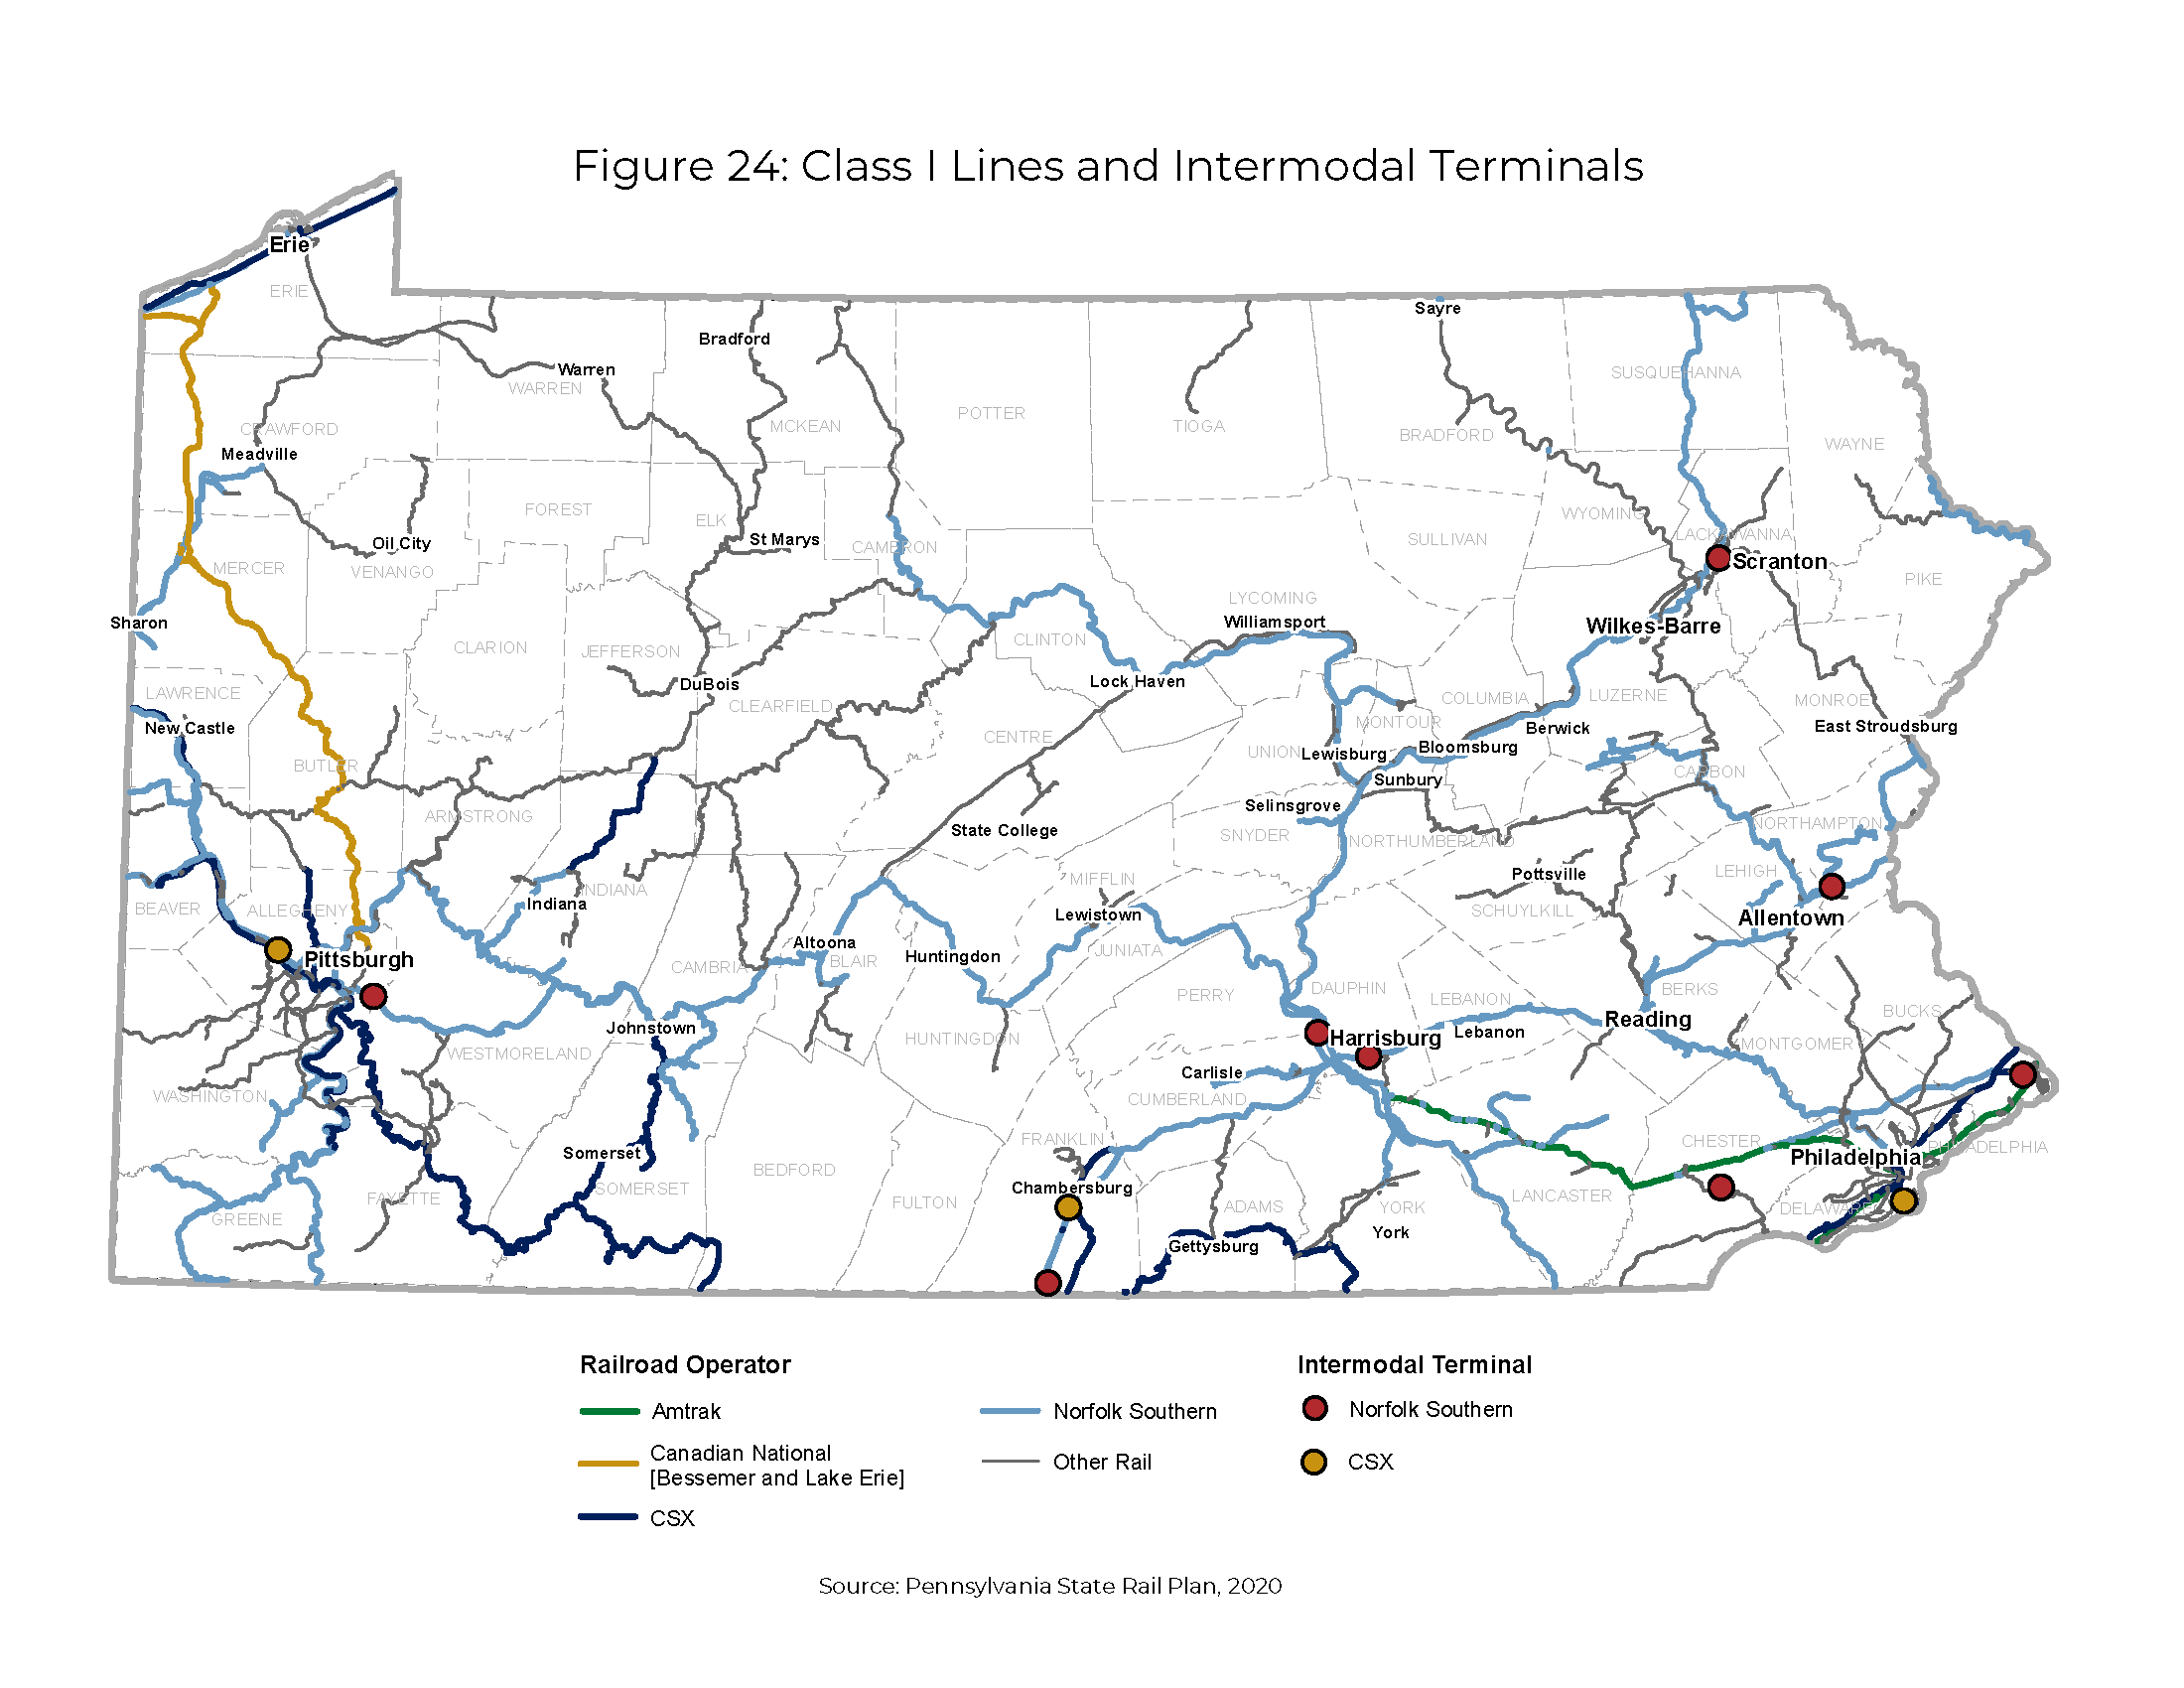
7. Passenger Rail
Intercity and commuter rail service with out-of-state connections
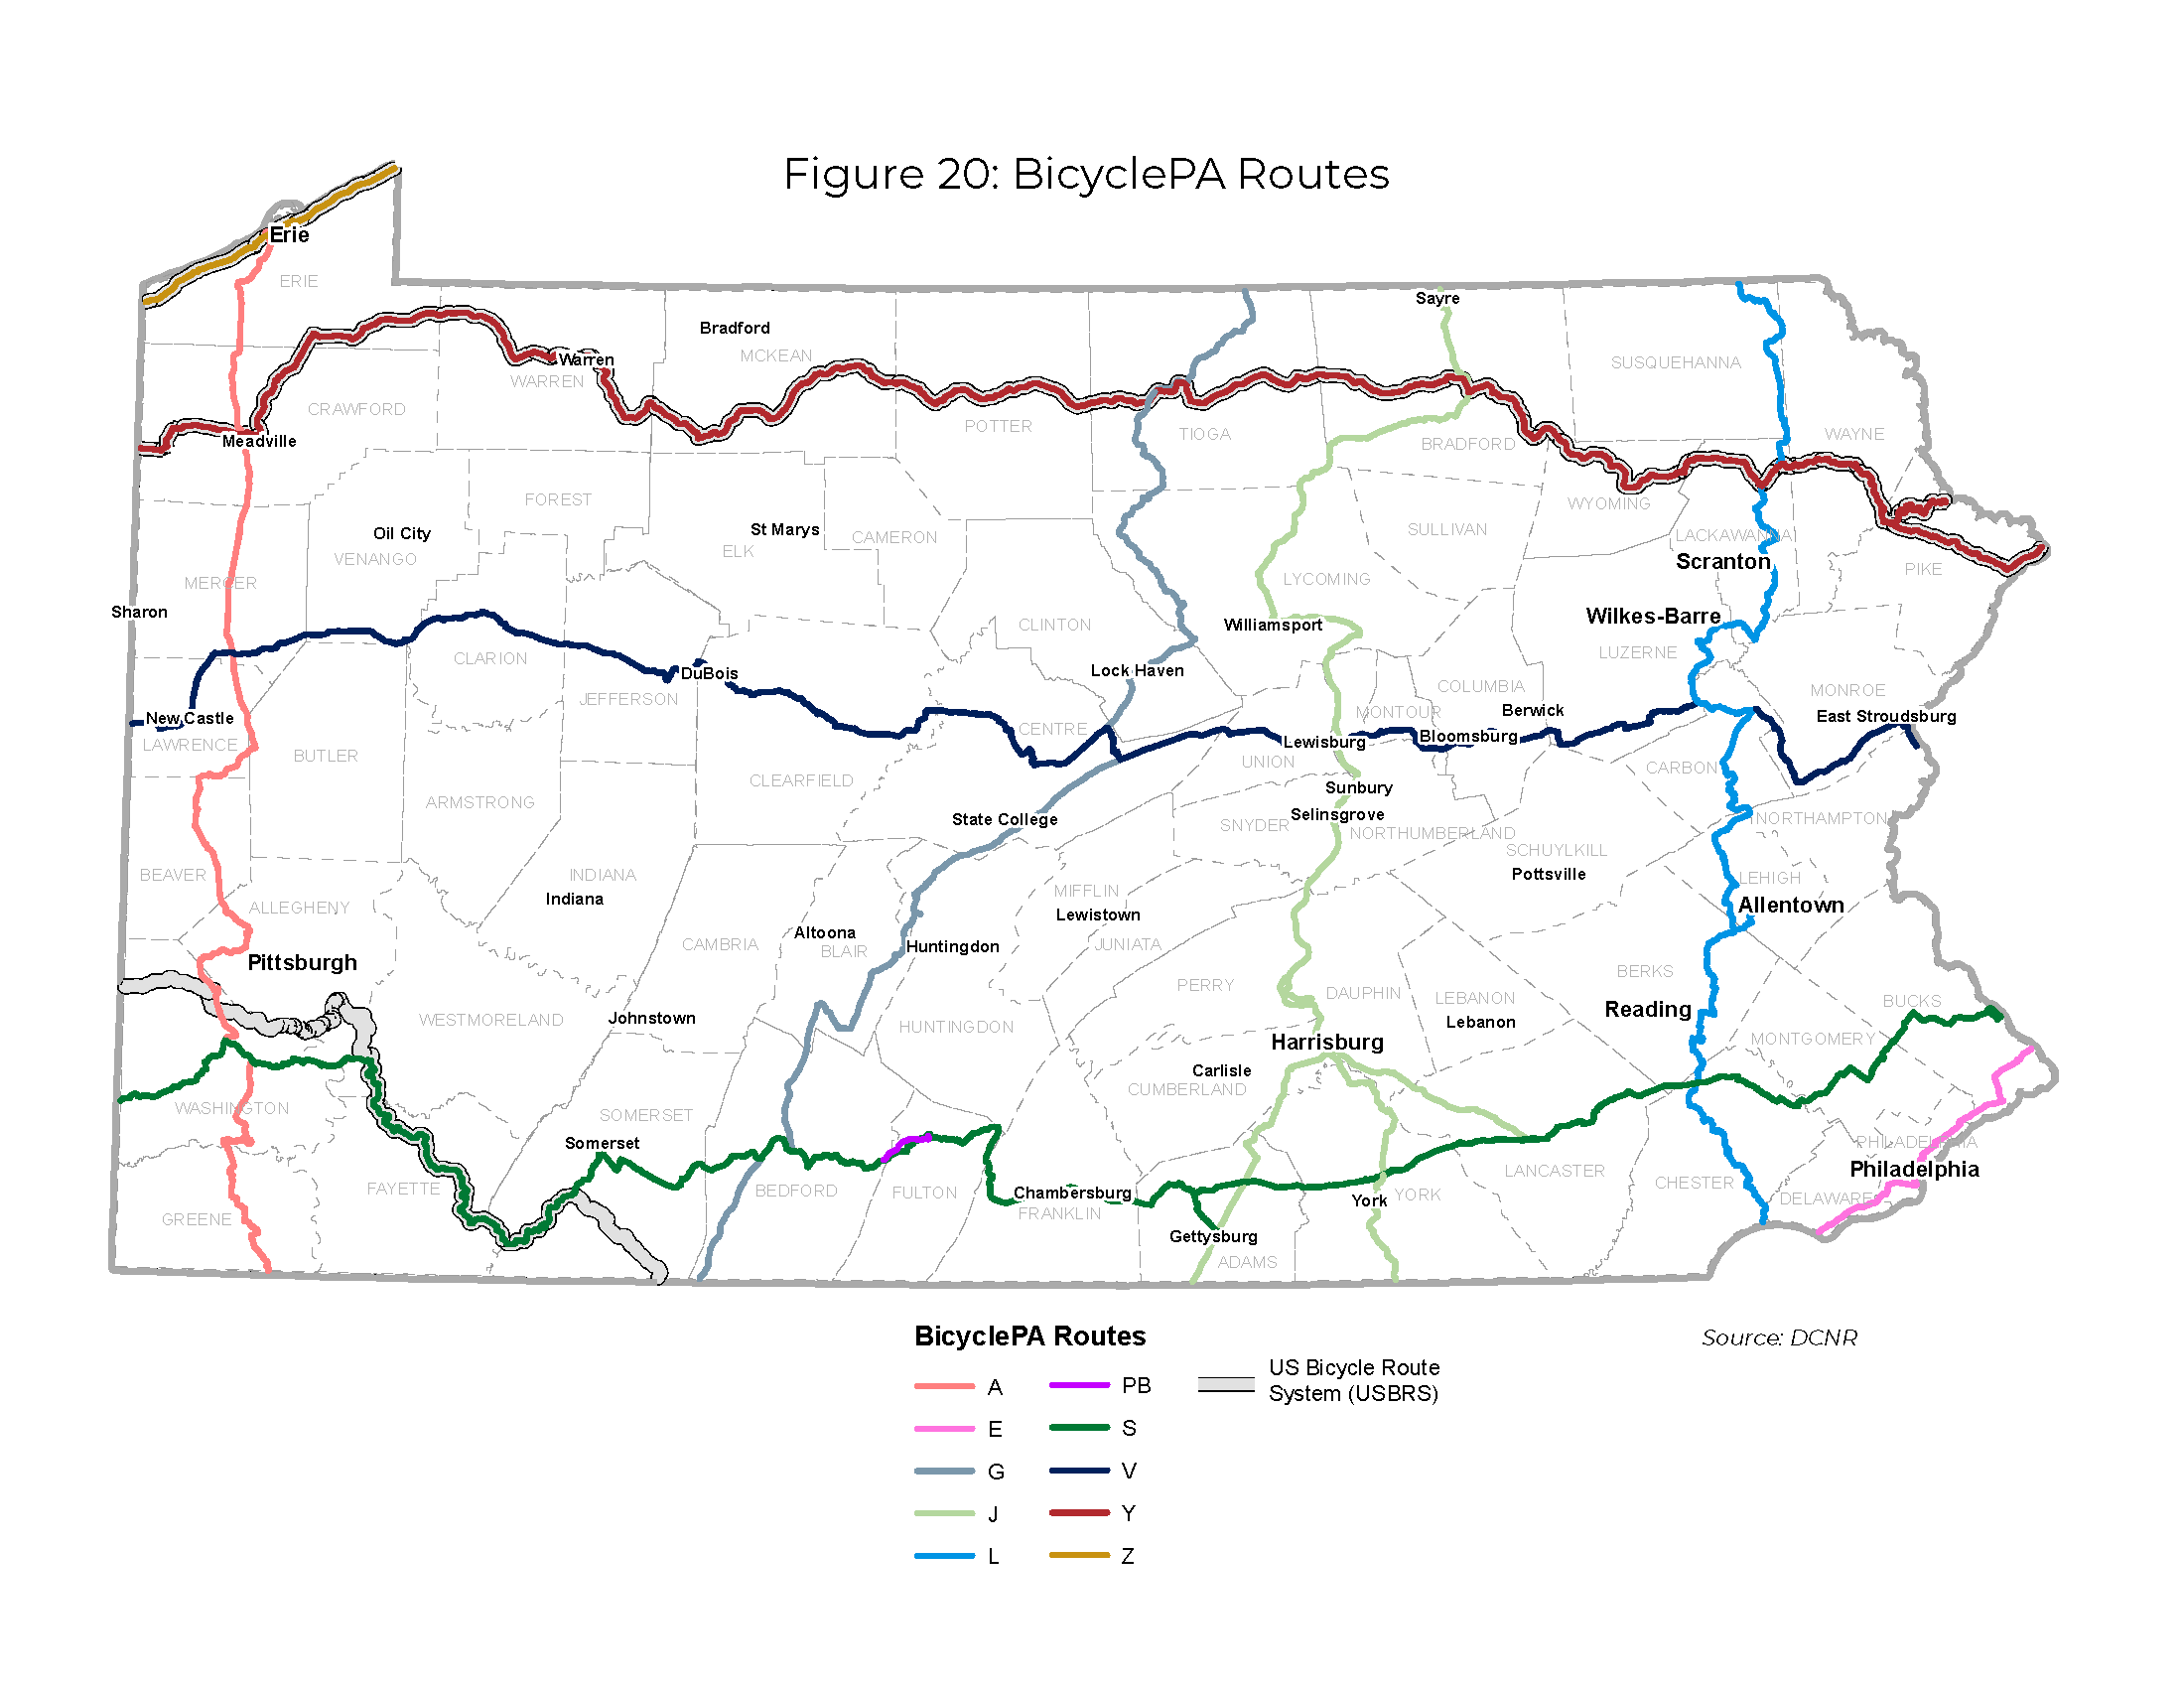
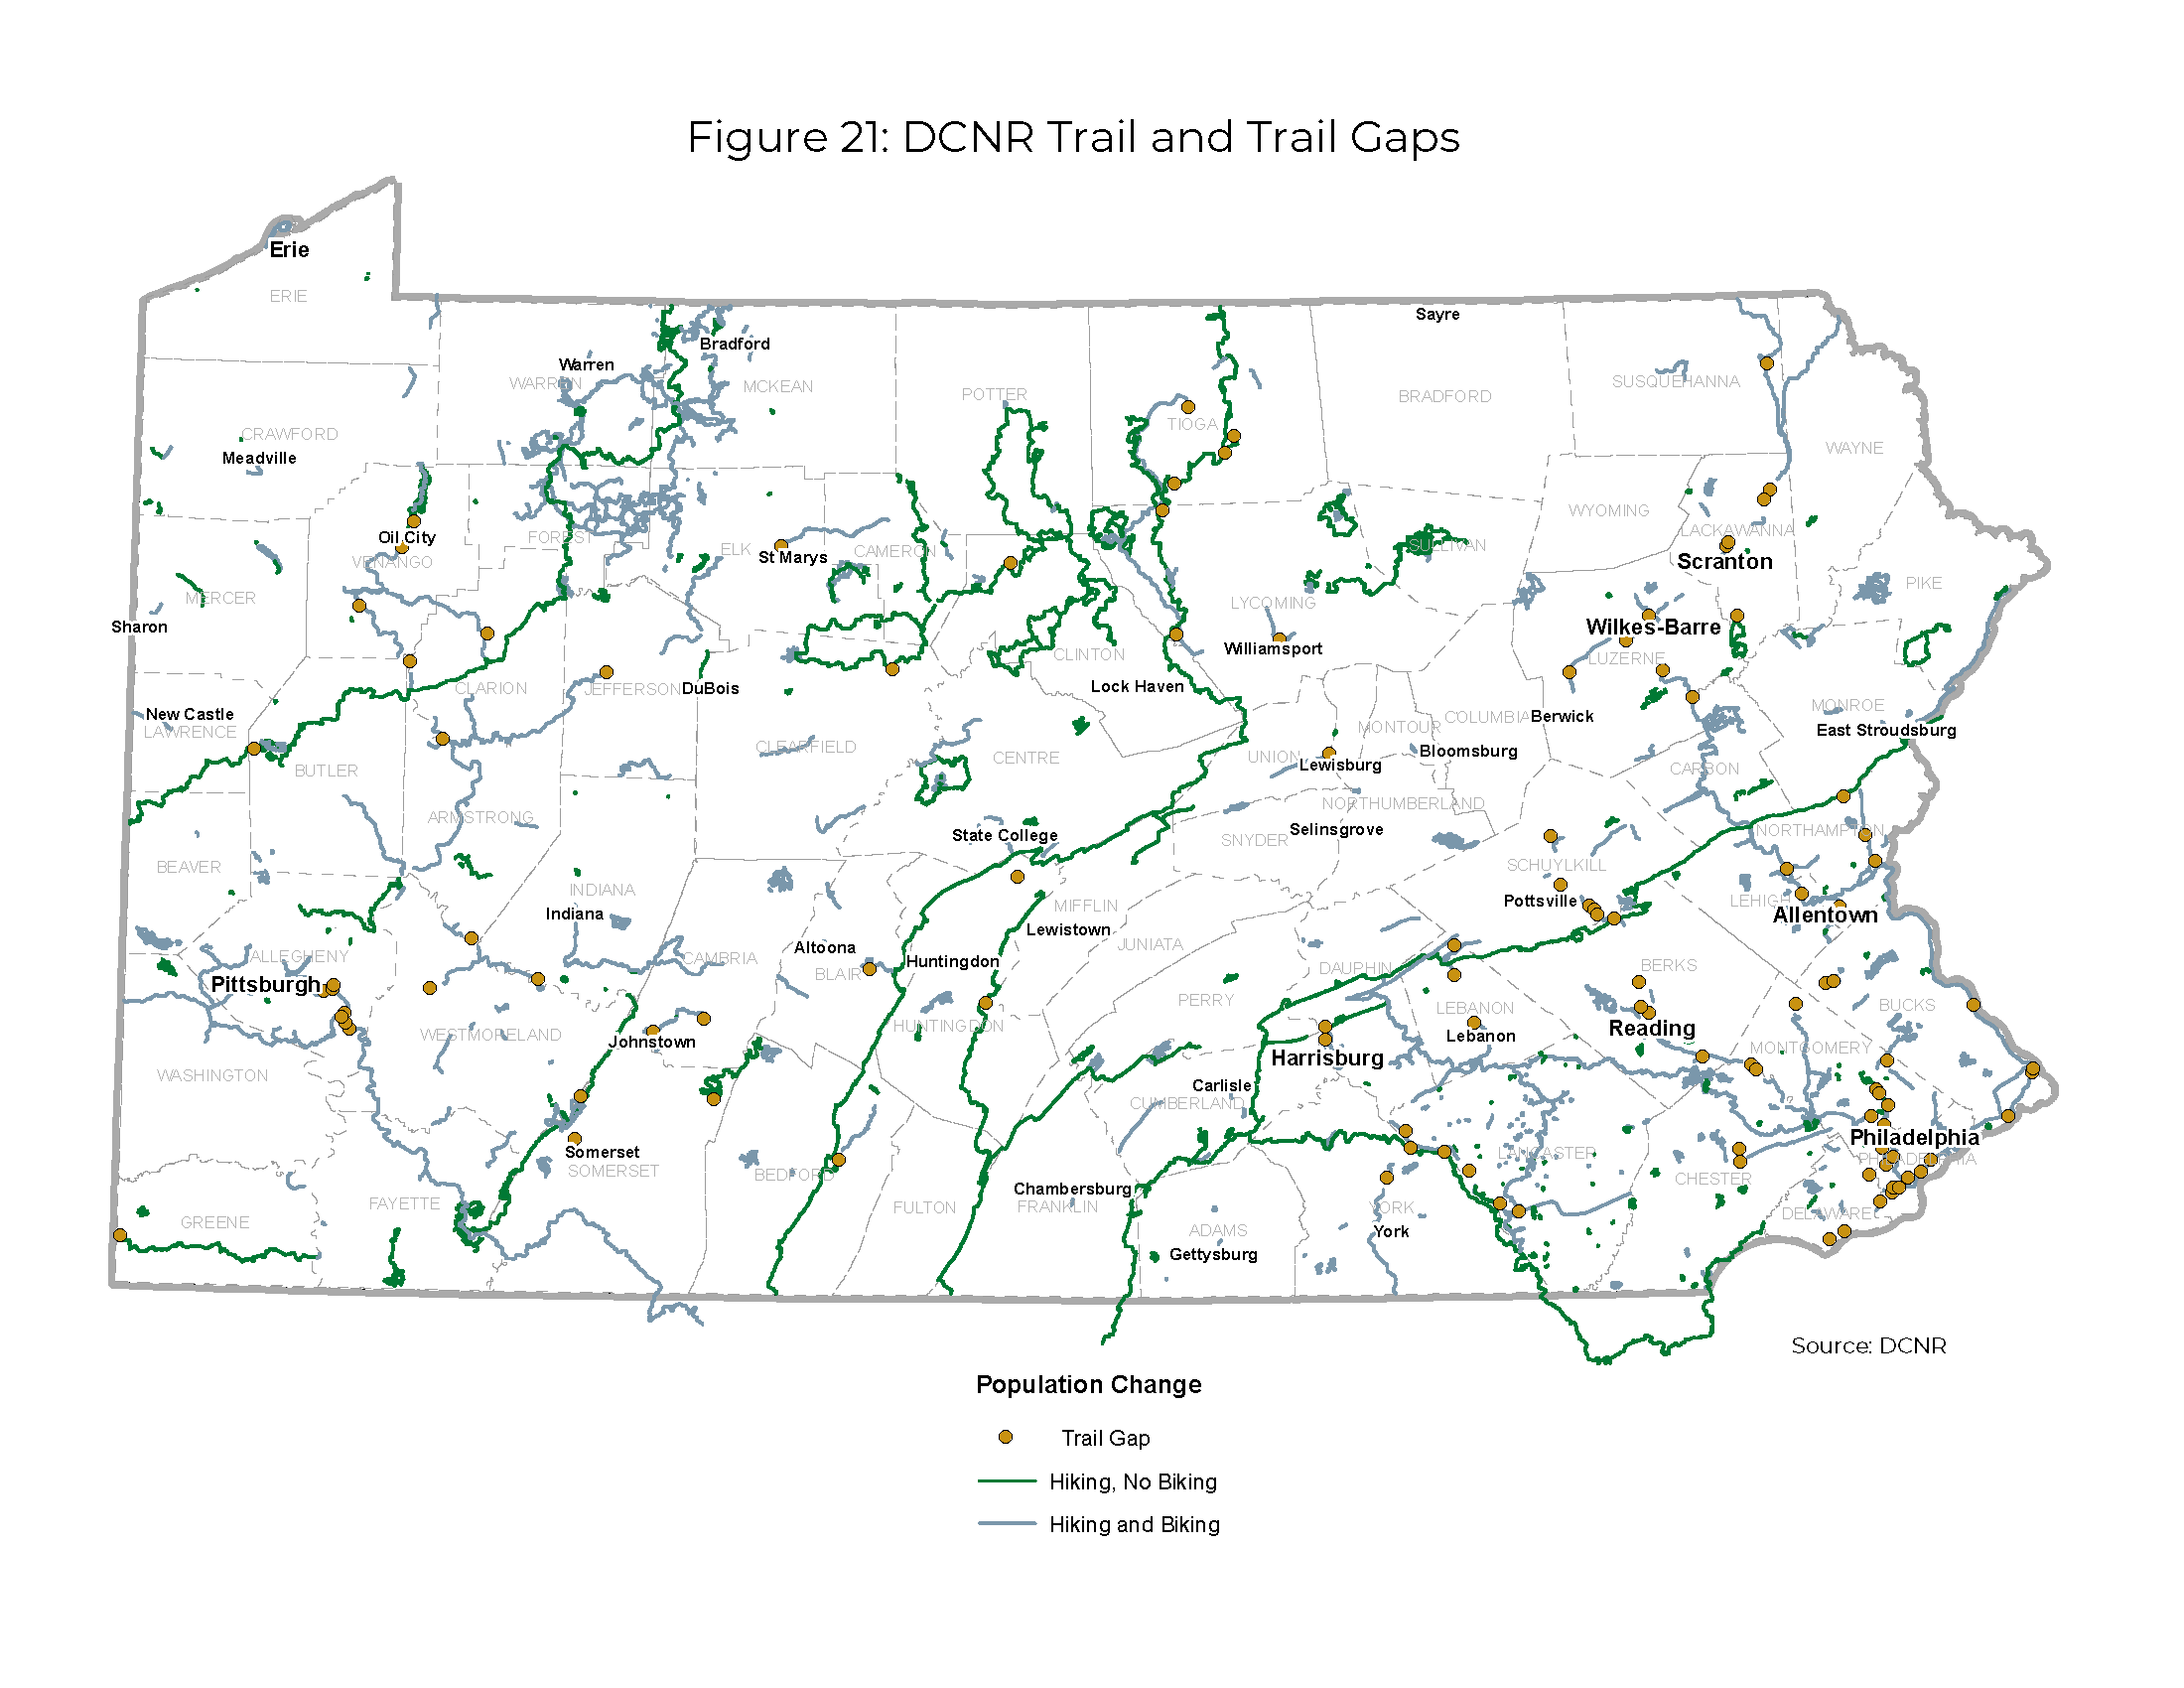
8. Bicycling
Safe routes and facilities throughout the state

9. Freight
Modern highways, railways, airports, and ports to support the economy

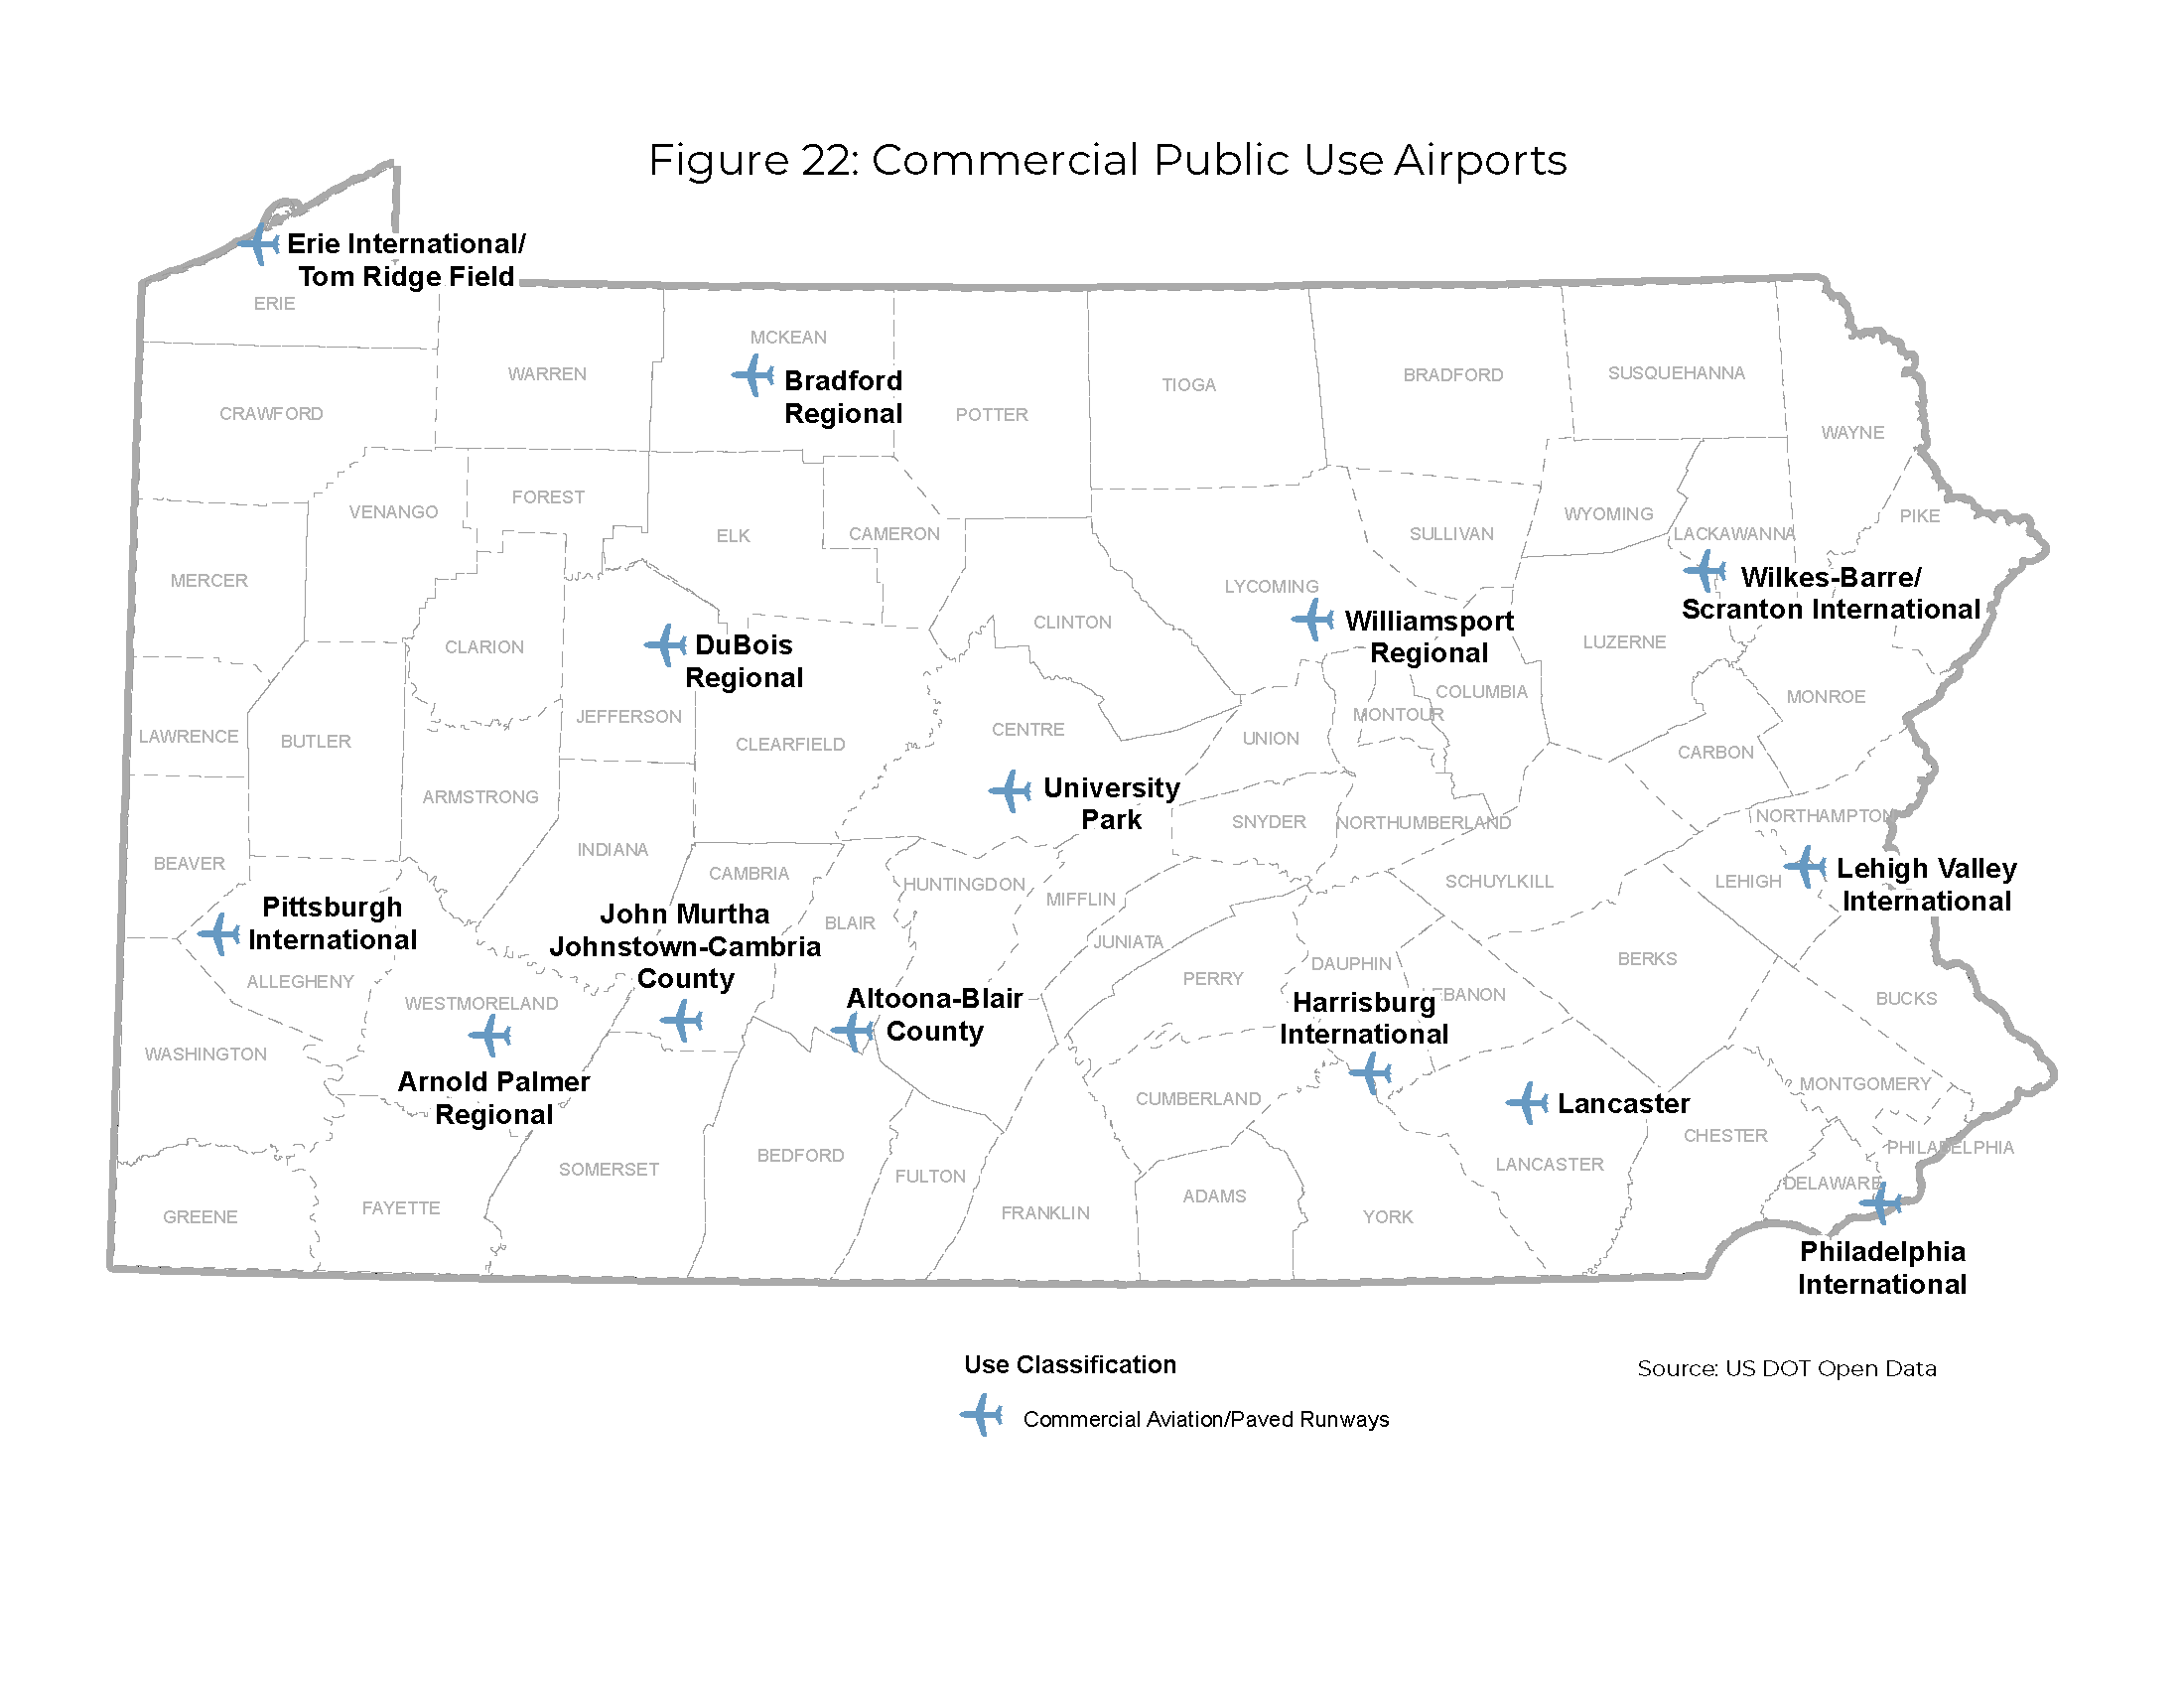
10. Aviation
Modern facilities, operations, and a wide range of commercial airline choices

Key Themes from the Freight Industry

Freight networks are critically important to the supply chain which moves essential raw materials as well as finished goods.

Issues such as truck parking will become more challenging as our reliance on goods movement continues to grow.

Trending issues such as automated vehicles, the explosive growth of e-commerce, and changing supply-chain patterns are poised to affect our planning.

It is imperative to reduce the impact of transportation on our changing climate.

We must abide by the value of fairness in working to meet the transportation needs of all our communities and citizens.

.png)
.png)
.png)